
The method I employ with my market operations does not include modern technical analysis (TA) – meaning moving averages, stochastics, etc. I did use them when I started and my results were atrocious. Of course, to be fair, I was completely clueless about anything market wise back then. One of my very successful mentors couldn’t have explained the difference between a moving average and a batting average. But being ignorant about modern TA certainly didn’t affect his performance. He was a master at looking at a chart showing only PRICE and VOLUME, and then understanding where (price) and when (time) that he wanted to enter and exit a market (almost always with profitably). I still don’t understand even half of what he profoundly understood. But, by far, the three most important “concepts” to understand are: the TREND of the market – bull/up, bear/down, or sideways/trading range; the SUPPORT and RESISTANCE zones/areas; and ACCUMULATION/bottoms and DISTRIBUTION/tops. Markets trade in TRADING RANGES most of the time. Most people are unaware of what that means, and they will get “chopped up”. And for most of the other people who are aware of their existence, they don’t like to trade them. I love them. But if you’re going to trade them, you need to excel at reining in your greed and therefore to be quick to take full or partial profits – meaning sell/short near the top into strength and buy/cover short near the bottom into weakness. Zero thinking involved. No emotions, almost robotic. That mentor of mine continually prodded me to trade those TRADING RANGES, because he believed that they are the very best way to learn how to become very successful in markets. There are so many great lessons to be learned. The very best traders that I’ve ever been around are magnificent at working with TRADING RANGES. You can make a magnificent living just focusing on TRADING RANGES.
As I’ve stated often, I love buying into markets that have supposedly “broken support”. The first chart is a 60 minute chart of gold showing the “breaking of support”/running of sell stops/place where the “manipulators” reverse their positions/ideal place to “take the other side”. You can see the top and bottom of the range. Point #1 on the chart shows the big selling wave (on a short term basis only, we need to learn not to put too much emphasis on each short term wave up or down). That selling wave closed at the bottom of the corresponding price bar, and along with the volume (#1) spike, it “warned” me that the “manipulators” were gunning for taking out the bottom of the RANGE (“breaking support”) and setting up a Richard Wyckoff SPRING situation. And you can see the result, so far that is.
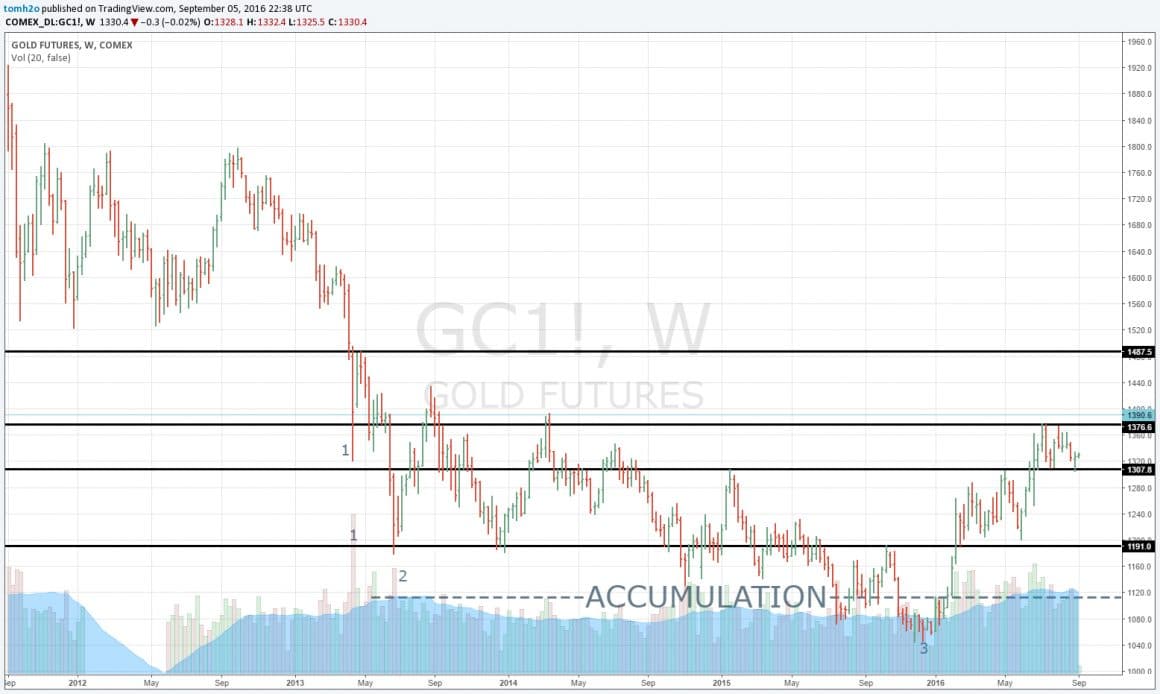
The second chart is a weekly chart over the last few years. This is the general process that I have been going through with this chart when I have given my gold outlooks over the last few years (archived).
#1 is the preliminary support (PS) or the “alert” that the beginning of the end of the DOWNTREND has started. But, definitely not the end. The PS is virtually always followed by a lower low.
#2 is the selling climax (SC) which is the ensuing lower low, with the volatile price ending well off of the low, and the volume increasing substantially, but, here’s the key, the volume must be less than at the PS. That shows the beginning of the downside pressure abating. The confusion comes in because you can have multiple SCs, but basically what’s going on is a testing and retesting process of the lows. It’s called ACCUMULATION and it’s incredibly important to learn, understand and respect it.
#3 is where I gave my first public recommendation to buy gold since late 2008. The point where I believed that combination of RISK and PROBABILITIES had become very favorable. And in this UPTREND in PMs, I am mostly focused on the miners.
And, BTW, you can use this general process for every time frame.

Leave a Reply