
The discussion following is about my longer-term outlook, my short-term trading view notwithstanding, is discussed here.
From a post back in May 2018, here, I once again discussed my view, that being very correct since 2009, for the stock market long-term – a very bullish outlook. There are multiple reasons for this view, those discussed over and over, but by far the main reason being the massive 10 1/2 year ACCUMULATION area which began in March 2001. Subscribers have heard me pontificate over and over about this topic. This is the REASON for the bull run for the last 10 years. All of the idiots since then, who have been totally wrong about their “crash” calls, have ZERO understanding of what moves markets. They have claimed – the economy, the overvaluation, the high P/Es, the debt, the Fed, QE, the govt, the deficits, blah blah blah.
In the re-post below, I discussed the 1970s, a very rough decade economically etc. Yet, the stock market put in a SIXTEEN YEAR accum area, and traded on the UPSIDE/RIGHT SIDE of that accum area from 1975 onward. And THAT is why we had the huge bull run into March 2000. But the point is, during those tough times in the 1970s, the STOCK MARKET WAS GENERALLY ANGLING UP.
In the 1930s, the same idea, with all the problems back then, yet there was an EIGHTEEN YEAR ACCUM AREA, and THAT is why we had the huge run into 1966-68. And we were on the UPSIDE of the accum area all thru the 1930s. The market was generally bullish thru the 1930s – generally, rallying overall. So am I too stupid to know that we are in a way below avg global economic environment? The permabulls certainly think I am. And that we are headed down again economically over the next several years? Yet I am very bullish overall – on the stock market. Why? MASSIVE ACCUMULATION YEARS AGO – STILL IN FORCE. It’s likely we have been in, and are going forward, a combination of the ’30s and the 70s.
———————————-
From May 2018:
There is a new post here discussing this exact topic, but since the “esteemed” Warren Buffet says it, then maybe people will believe what I’ve been saying for years – the stock market is not a bubble, not even close:
“When given the choice, billionaire investor Warren Buffett wouldn’t hesitate to buy stocks over bonds.
If I had the choice between buying the S&P 500 index or buying the 10-year U.S. Treasury, 30-year U.S. Treasury, it wouldn’t take me a nanosecond to go into stocks,” Buffett said Monday on CNBC’s “Squawk Box.” “It may be because bonds are going to fall a lot.”
And that bond market “bubble” (massive distribution area) is extremely bullish (long-term) for stocks, commodities, and cryptos. In the shorter-term, it’s going to affect markets, and is the “reason” for the increased volatility. That is here to stay. But once again, from April 9 –
“This is a secular bull market in stocks.
It is the bond market which is the huge problem market. The stock market is acclimating itself, re-energizing, via this area. It is getting itself prepared for the higher rates. To me all of the other “news” is pure noise.”
All thru the 1970s, all the inflation, soaring bond yields, conflict, currency problems, NY city’s near bankruptcy, etc. – did the stock market keep “angling up”?

Was that accumulation overall? Was there reaccum? Was there the retest of the breakout? Is there anything there that you shouldn’t be able to recognize? Was it wise to get off track by paying attention to all of the “news” (noise) then?
In the meantime, the volume on Friday’s rally really light, and SPY getting back into potential upthrust area. Maybe a rally, backup, and shoot for 268 magnet.
If you want to improve your ability to find the small (or bigger) stocks, to recognize the potential for an upcoming move (it’s about the period of preparation), to learn this and improve and really move forwards with your ability and performance, then you’ll do the work and study the charts. And you’ll get better at working “smarter” not longer.
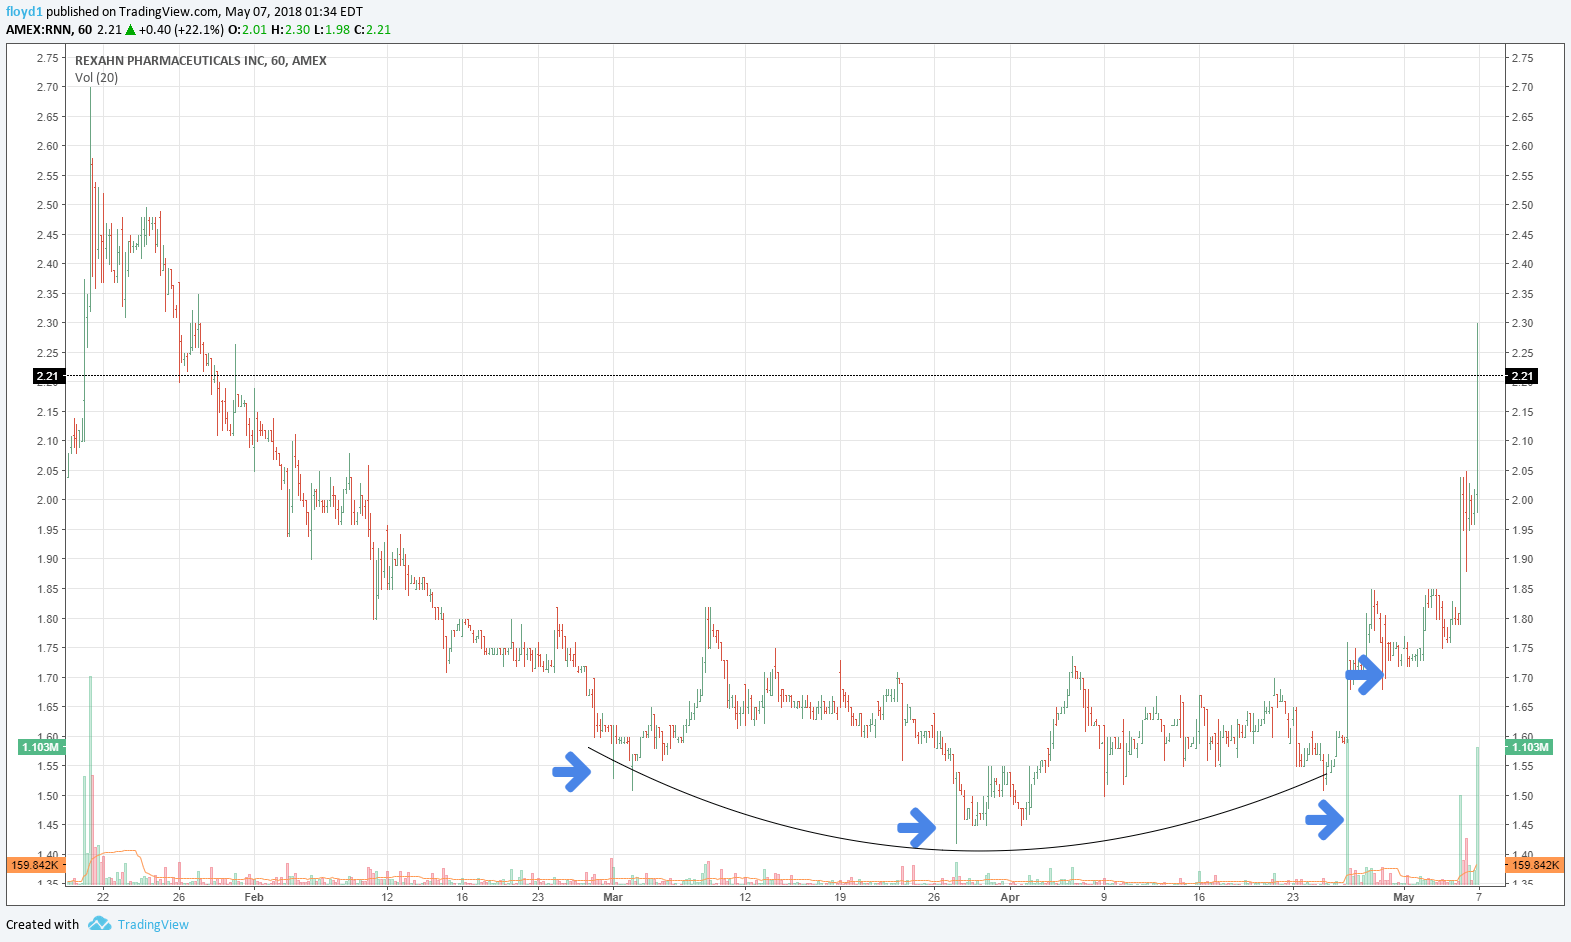
RNN was first mentioned on 4/27, and has rallied 30% since that posting – and NOT A DAYTRADE.
MBOT was also mentioned once again on 4/27, and two 10% opportunities in there.

EBIO mentioned a dozen times, along with EYPT, this chart of EBIO from 3/26, and at the arrow on chart #2 –


EBIO had share news ah on Friday, I was watching wanting to see it go below that 2.67 I had drawn in for a few days. Did not quite setup, but nice spring.

Several stocks mentioned last week “putting in huge tops”, CHEK, FUSZ, IMTE, MTUU and HTBX. Could be bounces there in any of them, but huge tops. MTUU actually had a nice bounce. TIME-FRAMES? And today FSNN looks like a pump, with an upthrust to form.
HTBX –

Leave a Reply